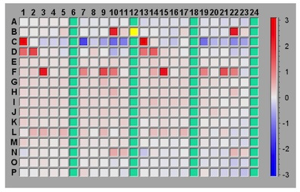
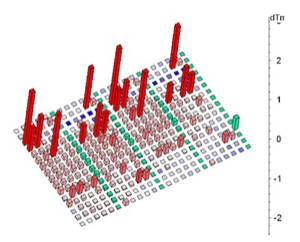
Barcode Representation:
Duplicate Data
Evolution & Development
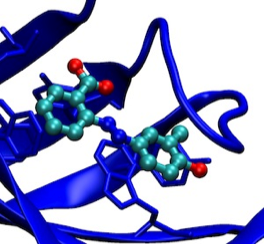
Ray Salemme, Mike Pantoliano, and Patricia Weber began collaborating on ligand binding thermodynamics while working at DuPont Central Research around 1990. During this period Weber et. al. determined the X-ray structure of streptavidin in complex with biotin (PMID: 2911722), one of the tightest small molecule ligand interactions found in nature. This work lead to a comparative structural and thermodynamic analysis of biotin binding versus the dye HABA that also binds in the streptavidin biotin binding site (PMID: 15299847)(PDF). Subsequently, structure-based drug design methods were applied to develop several HABA derivatives with substantially greater binding constants than HABA (PDF). Thermodynamic characterization of ligand binding to streptavidin was initially studied using isothermal titration calorimetry (ITC). However, later studies recognized experimental advantages of using differential scanning calorimetry (DSC) that manifest ligand binding effects as changes in Tm, the protein melting temperature, as a way of estimating ligand binding affinity.
Thermofluor (Original Reference) was initially developed in the period of 1996-1999 at 3-Dimensional Pharmaceuticals, Inc (3DP). At that time, numerous new drug discovery targets were emerging using genetic knockout or other approaches that often identified the functional importance of a target without identifying its biochemical function. Screening compound libraries against such targets consequently required the development of “label-free” screening methods that could be used to detect tight-binding ligands, potentially useful in modulating target function, absent information about any specific biological or biochemical function of the target protein.

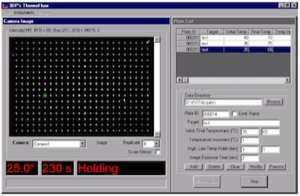
ThermoFluor instruments at 3DP ca. 2002
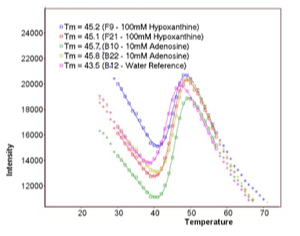
The basic technical motivation for thermofluor was to find a suitable biophysical readout that could accurately measure ligand-induced changes in protein Tm without requiring the large quantities of protein required for a conventional DSC experiment. Initial experiments measuring protein Tm were carried out by Mike Pantoliano using light scattering as an indication of irreversible protein denaturation. Subsequently, Ray Salemme suggested that using a dye like ANS, which was known to fluoresce when bound to thermally denatured proteins, might provide a useful readout. In fact, experiments that measured fluorescent readout provided a clean signal that appeared to correlate well with measurements made using DSC. An engineering team was organized under the direction of Joe Kwasnoski that ultimately developed several generations of instruments based on a 384-well plate format. Data reduction and analysis software was developed by Victor Lobanov, working in 3DP's cheminformatics development group led by Dimitris Agrafiotis. Thermoflour was subsequently used as the principal high-throughput screening (HTS) method at 3DP and the technology was furnished by 3DP to several major pharma companies under technology transfer agreements. A 1536-well plate instrument was under development when 3DP was acquired by J&J in 2003 and thermofluor has continued in HTS applications at J&J.
Thermoflour equipment developed at 3DP was highly optimized for HTS applications using ANS as the reporter dye, and allows screens of 5,000 to 10,000 compounds with 1mg of protein. Subsequently the wide availability of low-cost PCR machines, able to thermally cycle sample plates and measure fluorescent readout, together with the public availability of data reduction and analysis software, has lead to the wide adoption of the method in the biomedical and structural biology community. Thermofluor experiments performed using PCR machines typically use the dye SYPRO-Orange, since PCR instrument optics are optimized for this dye. Reported protein use levels using PCR machines and SYPRO-orange are in the range of ~100 samples tested per mg protein.