Molecular Illustration
The development of illustration methods has always been key to understanding protein structure and function. Although powerful computer graphics methods make structure easily accessible to modern structural biologists, this was not the case in the early days.
In the early days, it was usual for molecular structure illustrations to be made using programs originally developed for small molecules like ORTEP.
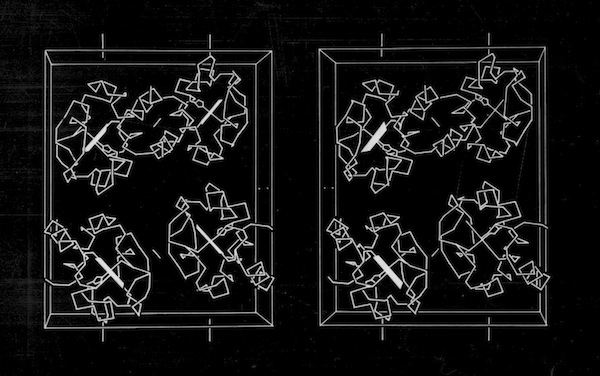
Early versions of ORTEP lacked the ability to discriminate overlapping bonds, so that a tedious retracing was required to produce a publication quality drawing, in either mono or stereoscopic representation. Drawing production was usually facilitated using a large-scale stereoscopic viewer that allowed tracing from computer generated plots.

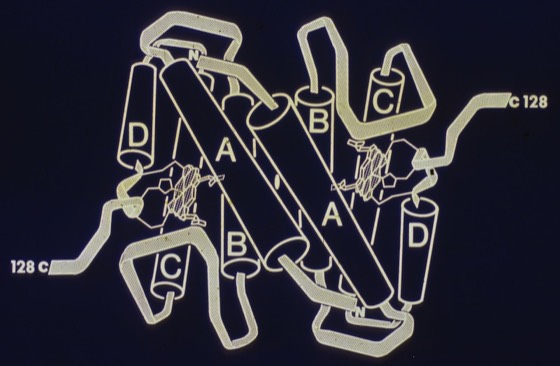
In 1976, I began to experiment with ribbon representations that made overall folds and differences in protein structures easier to grasp. These were drawn by making india ink tracings of ORTEP plots, usually viewed using a large-scale stereo viewer built for the purpose. As more structures began to emerge, ribbon representations became more common, with Jane Richardson developing a large and artistic portfolio of protein drawings that began to standardize representations of protein structural elements like alpha helices and beta sheets.

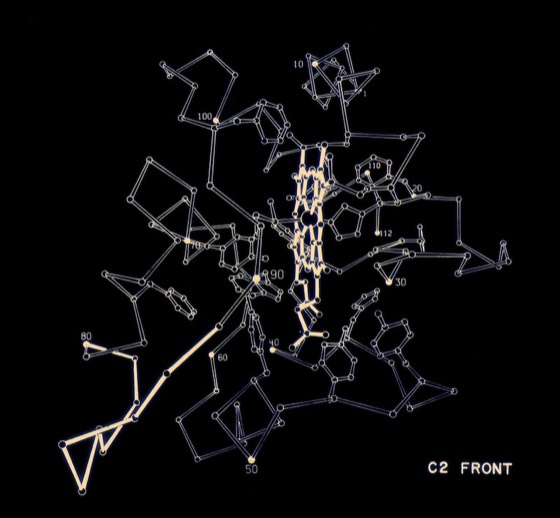
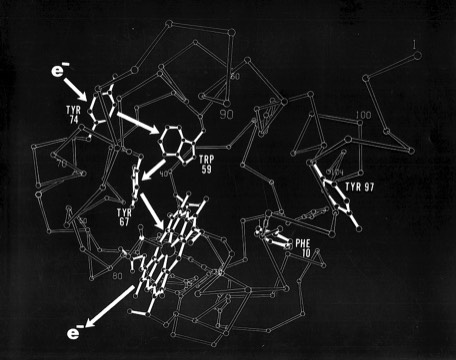
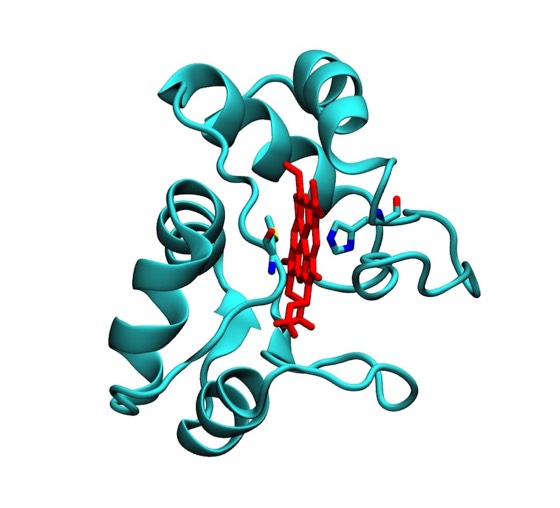
Functional drawings, like the cytochrome c2 heme binding schematic shown left, combined features of detailed side chain representations with schematic backbone representations. Although a trivial task with modern computer graphics, generating such drawings by making india ink tracings from ORTEP plots, using a large-scale stereo viewer, was quite laborious.

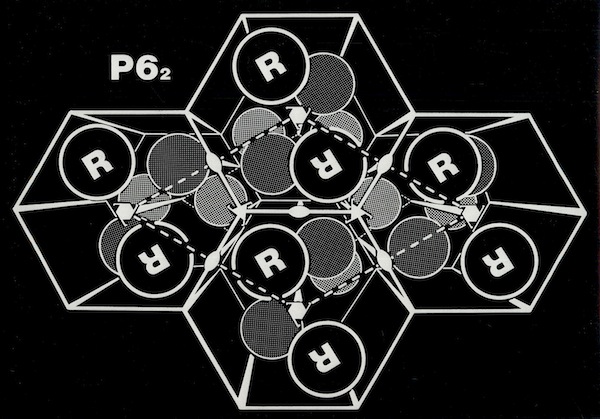
Crystal Cells
Modern Graphics
Advances in computer generation of images and computer graphics completely changed the landscape of molecular illustration.
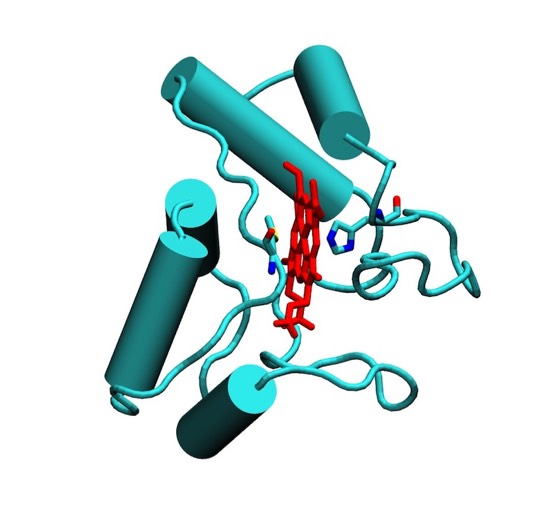
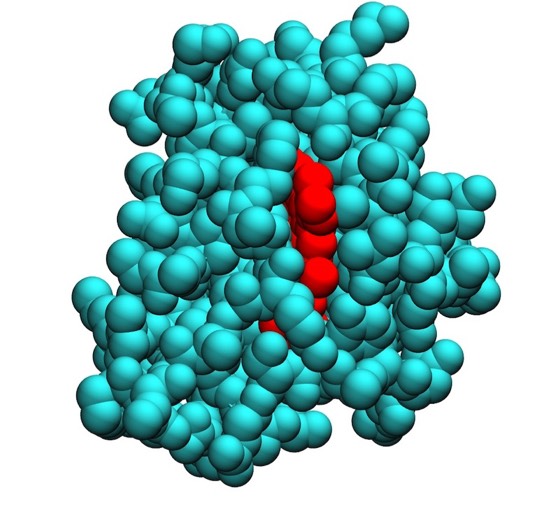
Lesk and Hardmen developed an algorithm for the computer representation of ribbon structures while Richard Feldman at the NIH was among the first to develop VDW surface visualizations of protein structure. Later innovations stemmed from Lee and Richards landmark work on solvent accessible protein surfaces, which were first computed and illustrated by Connely.
Virtually all of these methods of illustration are now instantly accessible with modern molecular graphics programs. Many of the molecular illustrations on this website have been generated using the VMD system built in Klaus Schulten's lab.